
 It’s sharing time!
Over the past few years, we’ve shared different versions of this reading tracking spreadsheet and each year it’s been improved by one of you! And I’ve received so many email messages and requests for more options from readers who absolutely adore it.
This past few years has been a difficult one for reading for many people. Sometimes reading was all I wanted to do, and sometimes I struggled to get into a book. I still used my tracking spreadsheet, though, and adding new titles gave me a little boost every time.
The value of keeping up with my reading tracking each year is that it helps me maintain two habits that I value:
- Logging my reading each week (or every few days)
- Examining what I am reading more closely as the data set builds
The great thing about this spreadsheet is that it’s so very easy to customize – especially now. You can modify or add columns of data and track the things that are important to you. I’ve made additions to track where I found the book (e.g. Library, NetGalley, Amazon, Kobo, Hoopla, etc).
Most Important!
First, and most important, THANK YOU ANDREA. The original spreadsheet was created and shared by Andrea in the comments of podcast Episode 275 about Reading Habits. Thank you so, so very much, Andrea. We wish you the most excellent of reading for the rest of your waking life.
And second, THANK YOU ESTELLE AND MAX! The spreadsheet is SUPREMELY easy to customize thanks to Estelle and Max’s alterations, and I cannot tell you how much I love it.
Thank you to Elizabeth, Janet, and many others who have commented about their own improvements and suggestions, some of which I’ve incorporated to improve this one.
Want to get started and not read any more about tracking your reading? I get it – here, you can go directly to the spreadsheet download link.
If you’re curious about why and how we track our reading using this shared spreadsheet, read on!
Tracking your reading?
Doesn’t that mean you’re entering a lot of books?
Oh, yes. Yes, it does. And that means delicious, nutritious data!!
Present and Future Sarah do not ever remember what Past Sarah did, so Past Sarah tries to help out by leaving us notes. And since I receive a lot of books well in advance of publication date, or after a long library hold, leaving myself a record helps me manage my reading.
Combining my Reading Planning sheet and Andrea’s original Reading Tracking sheet into one spreadsheet with three tabs consolidated my reading info into one location. You don’t have to use the To Be Read tab if you don’t want to, but in case it would be useful, it’s available.
If you struggle to remember to update the sheet, may I suggest a weekly reminder? Back in 2019 (remember then?) I set reading goals for myself and I set a weekly reminder on my ToDo-ist to log my reading every Friday so I don’t miss anything. (NB: affiliate link if you want to try ToDo-ist out – I use it to run most of my daily life, alongside Google Calendar.)
Because I’ve been tracking my reading list and my reading habits for so long, I have insights into my reading tastes, what books I sped through quickly, which ones I savored, and which genres are showing up in greater numbers in my history. Each year I make a few changes based on those insights to capture new things I want to track.
You do not, of course, have to use the columns in the sheet as given. You can track whatever you want, and change them to account for aspects of your reading that are important to you. This is why the spreadsheet is so nifty, and why I really enjoy using it.
Here’s a link to a copy of the 2023 Reading Tracking Spreadsheet:
https://docs.google.com/spreadsheets/d/17bDO0DQXt-fNzQmCAI9WHn0layfTSKJUJ7hdcge_tJI/edit?usp=sharing
This link is view-only.
Ahem.
This Link is View-Only.
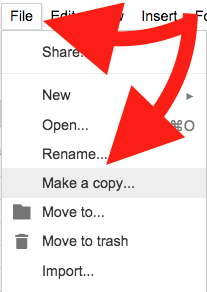
All you need to do is click File, then Make a Copy to save your own version to your Google Drive.
Let’s take a tour, shall we?
Starting with the Books Read 2023 tab: this is where you enter the data on the books you’ve read.
![]()
Title, Author, Series, Pub Date, Pages, Format, and the date started, ended, and days read fields are all pretty self explanatory.
The genre fields, and the fields about diverse characters and marginalized writers require a few notes.
First, be consistent about what terms you use. Currently, the genres listed are as follows:
- DNF
- Category Romance
- Contemporary Romance
- Erotic Romance
- Romantic Suspense
- Women’s Fiction
- Historical Romance
- Paranormal Romance
- Fantasy Romance
- Sci-Fi Romance
- Graphic Novel
- Fantasy
- Urban Fantasy
- Steampunk
- Sci-Fi
- Historical Fiction
- Mystery
- Thriller
- Nonfiction
- Teen/YA
- Other/TK
- Other/TK
- Other/TK
- Other/TK
You can use different terms or fill in new ones instead of “Other/TK.” You can also use more than one term to describe a book.
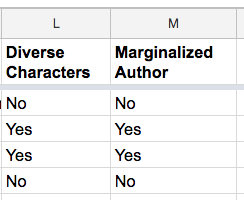
Under columns such as Diverse Characters and Marginalized Writers, you also need to be consistent in what you enter in those fields. You can use “Yes” and “No” as the answers, as I have in the sample data, or you can be more specific, as the chart on the next tab will support multiple terms. Just be consistent. You can’t mix up “Yes” and “yes” or your data will be a bit wonky.
In Book Source, I am tracking where my books come from: the library? Amazon KU? Kobo? Hoopla? NetGalley? As with the other columns, you have to be consistent (e.g. “NetGalley” and “Netgalley” will produce separate results in the charts on the next tab) but you can enter as many sources as you use to find your books: Scribd, AO3, FanFiction.net, Tumblr, Libby, Little Free Library, etc. The possibilities are endless.
You don’t have to use any of these columns if you don’t want to, of course. You can make up your own things to track. Just make sure to use consistent terms for that data so the Statistics render correctly.
Statistics
Now let’s look at the Statistics page because this is where the magic happens.
Andrea, as the original creator of all this spreadsheet magic, deserves all the praise and applause, as do Estelle and Max for upgrading the genre list to make it even easier to edit!

I love this gif and I love the cream gown on the woman who stands up first. Anyway.
On the second tab, the data you entered from the first tab is turned into graphs, statistics, and charts that allow you to see the results of your reading.
Pivot Tables, Oh Yeah.
The spreadsheet as I’ve shared it has some sample data that you can delete, obviously. That data is only provided to give you a preview of the statistics that are being tracked.
For example:
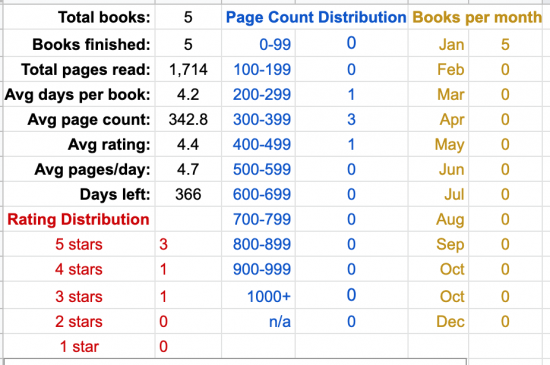
Books Per Month, Rating Distribution, and Page Count are also displayed in graph form below those tables.
Then we get to Categories and this is the part that Estelle and Max improved so brilliantly.
Here’s the current list of Categories:
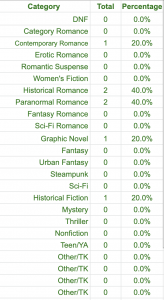
Thanks to the magic of Estelle and Max’s edits, all you need to do is change the label of the category in Column G.
Change the name, and make sure you use that name in the same format on the Books Read 2023 tab.
The category statistics are compiled from the data entered in column K of the “Books” tab. So if you added “Historical Fiction, DNF” as the genre/category for Pride and Prejudice, your statistics would include 1 Historical Fiction and 1 DNF. As Andrea noted in her original construction, totals may be higher than total number of books because categories may overlap.
You’ll notice that several of the categories read “Other/TK.” It’s easy to make changes now: type in the genre or category you want to add, or change one of the existing labels to fit your tastes.
Again: the words you use have to be consistent, and that includes capital letters. “Western” and “western” are not interchangeable.
Additional Graphs – Make Your Own, Customize, Have Fun!
Then there are the graphs at the bottom: Diverse Characters and Marginalized Writers. You can adjust the titles and the data to fit your own needs or goals, of course.
The data you enter into columns L and M on the “Books” tab create the pie charts on the “Statistics” page:
So:
Becomes:

These charts are based on the sample data I entered, and I kept the fields as “Yes/No” for ease of demonstration.
You can customize these columns and charts to fit your own reading goals, interests, and habits.
For example, if you read mostly queer romance and want to focus on detailed representation of sexuality, instead of Column L reading “Diverse Characters,” you can change it to “LGBTQIA+?” and track more specific options, such as characters who identify as Gay, Lesbian, Transgender, Aro, Ace, etc.
So with this data:

The pie chart would look like this:

As long as you are consistent with the terminology, your chart should accommodate the data.
Make it your own to help you!
Again, the data shown here is all based on the sample books I entered. Once you delete the sample data and begin entering your own, you’ll see your own reading history. I have found using this spreadsheet to be very inspiring: I want to keep reading and keep adding to my totals, and I already read quite a lot.
Again, you can grab your own copy of the 2023 Reading and Books Data Spreadsheet by clicking this link, and, inside the Google Sheets menu, clicking “File — Make A Copy” to create your own spreadsheet inside your Google Drive.
I hope this spreadsheet is helpful. Again, massive thanks to Andrea for sharing the original version, and to Estelle and Max for the category upgrade, and to everyone who has made suggestions for refining and customizing each version.
What do you want to track? Do you think this will be useful for your own reading habits? And did you track last year? What did you think?
Happy New Year of Reading!

I’ve used this since the year you introduced it and I have a question. What, if anything are the differences between this years spreadsheet and last years? Will I lose anything vital if I stick with the copy of last year’s spreadsheet? Thanks for your help.
@PamG: Nope, you won’t lose anything, but you’ll need to update the dates in the stats tab to include 2023.
If you click on the field for “books per month” you’ll see a formula that looks like this, except the years will read 2022:
=COUNTIFS('Books Read 2023'!I:I,">=1/1/2023",'Books Read 2023'!I:I,"<=1/31/2023")'Books Read 2023' is the name of the sheet, so nbd I don't think.
But the M/D/Y field will likely need to be updated to 2023, if you want to know your monthly totals.
Please let me know if that doesn't make sense. I am not entirely fluent in "explain Excel."
This is so delightfully wonky. 🙂 I will cling to my old-school manual reading journal, but I love you all for being Like This about what you read!
Thanks, Sarah. That sounds pretty straightforward. I should be able to muddle through.
THANK YOU I find it so interesting to see what I read. My high school daughter tweaks it to show reread/new read too.
I do love this. I’m an ocd virgo and retired oldschool librarian. Question: How to get good stats on audiobooks. Can’t enter “pages read” but…I’m not a pivot table user, and have no idea how to add a column for hours on the first tab that will show up on the next tab as “hours listened”. I’m not likely to go back and research the print editions to find pagination data (which BTW doesn’t show in Libby for ebooks). Is there any hope for me?
Thanks for this. I’m not computer savvy but even I can use this spreadsheet.
@GwenPeds: For audiobooks, I use the pages of the print edition. But if you’d like to track hours listened, how would you like that information to appear on the stats page? Total for all books?
I’ve been using this spreadsheet (that I customized for my own reading and habits) for 4 full years now. This will be year 5. I love it! I love adding books to it and start to see the data accumulate. And now that I have a few years worth of data, I can see some trends in how my favorite genres evolve, if I’m getting better at diverse reading, etc. I think it’s so much fun and can’t thank you enough for putting it out there.
@Misti: thank you! I am so happy it works for you!
I started using the spreadsheet last year with mixed success. I have to make notes IMMEDIATELY after reading or it won’t happen and since I rarely have my laptop out anymore I started making an entry in a Note on my phone and periodically adding it to the spreadsheet. Of course, now at the end of the year, I have six months of cryptic book notes on my phone. I know I could try entering them in the spreadsheet from my phone; I just don’t like working in documents on a micro view level.
Really though, this is a huge win over not tracking my reading at all. I’ve gone back and searched my notes several times to find things. And for anybody wondering, search-ability and sort-ability are why I find the spreadsheet superior to written journals. It’s been really useful when I’m considering a book and can search and say “yep, tried this author and DNFed.”
I’m going to have to take Sarah’s advice and make an appointment with myself to enter my reading weekly this year.
This is amazing!! Thank you to everyone who had a hand in creating this!! I just fiddled with it and created some of my own categories and I even figured out how to edit the pie chart labels, woo!