
 We’ve shared a version of this reading tracking spreadsheet for two years now, and I’ve received so many email messages and requests for more options from readers who absolutely adore it.
Poorva C. wrote to me:
“I just wanted to say thanks for creating the Reading Tracking spreadsheet – it’s been a godsend, both so that the books I read don’t slip through my sieve of a memory, and for making sure I read diversely.
I looked at a bunch of other trackers, and SBTB’s was easily the best balance of detail and user-friendliness, and modifying the columns to better reflect what I read (I adore romance, but I will admit to a fondness for othe genres as well) was easy even for an Excel noob like me.
Please pass on my sincerest thanks to Amanda (I think it’s Amanda?) (SW: Andrea, but close!) for all the hard work she put in to ensure we get the pretty pie charts and stats bars. Seeing how many (or how few) marginalised authors I read has been a HUGE motivator and I hope there are plans for a tracking spreadsheet in 2020!”
Aw, heck yeah, there are plans for a 2020 tracking spreadsheet. I’ve got it right here!
I LOVE THIS SPREADSHEET SO MUCH. I’ve used it all year, I love it, and I’m so pleased I’m not alone in enjoying the process of tracking what I read and how I read, too. I’ve made a few updates to the 2020 version, but the great thing about this spreadsheet is that it’s so very easy to customize. Aarya has a version that she’s modified to track an extensive number of book characteristics, for example. So you can make it your own!
Most Important!
First, and most important, THANK YOU ANDREA. The original spreadsheet was created and shared by Andrea in the comments of podcast Episode 275 about Reading Habits. Thank you so, so very much, Andrea. We wish you the most excellent of reading for the rest of your waking life.
Want to get started and not read any more about tracking your reading? I get it – here, you can go directly to the spreadsheet download link.
If you’re curious about why and how we track our reading using this shared spreadsheet, read on!
Tracking your reading?
Doesn’t that mean you’re entering a lot of books?
Oh, yes. Yes, it does. And that means delicious, nutritious data!!
Some background: I’ve been using – wow, for four years now – a Google spreadsheet to track my future reading. I needed to know four major pieces of info:
- what I wanted to read and when
- what genre it was
- when the book was coming out
- where the book or ebook file was so I could find it.
Present and Future Sarah do not ever remember what Past Sarah did, so Past Sarah tries to help out by leaving us notes. (We get along pretty well, the three of us, thanks for asking!) And since I receive a lot of books well in advance of publication date, or after a long library hold, leaving myself a record helps me manage my reading.
After two years of keeping both spreadsheets, one to track what I’m going to read in the future (mine), and one to track what I have read so far (Andrea’s) my reading has changed a lot. I’m aware of changes in my reading tastes, what books I sped through quickly, which ones I savored, and which genres are showing up in greater numbers in my history.
In 2019, I set reading goals for myself (and met them – yay, me!) and I learned to set a weekly reminder on my ToDo-ist to log my reading every Friday so I don’t miss anything. (NB: affiliate link if you want to try ToDo-ist out – I use it to run most of my daily life, alongside Google Calendar.)
For 2020, I’ve made a few changes to the spreadsheet for things I want to track, and I’m including them in the shared version. You do not, of course, have to use my columns! You can track whatever you want, and change them to account for aspects of your reading that are important to you. This is why Andrea’s spreadsheet is so nifty, and why I really enjoy using it.
For the 2020 version, like the 2019, I’ve combined my Planning sheet and Andrea’s original Reading sheet into one spreadsheet with three tabs. You don’t have to use the To Be Read tab if you don’t want to, but in case it would be useful, it’s available.
Here’s a link to a copy of the 2020 Reading Tracking Spreadsheet:
https://docs.google.com/spreadsheets/d/1cAOcst_cj4bPjBGNcxv1tkMdIsAhhhwuYkfkd8bBTq0/edit?usp=sharing
This link is view-only.
All you need to do is click File, then Make a Copy to save your own version to your Google Drive.
Let’s take a tour, shall we?
Starting with the Books Read 2020 tab: this is where you enter the data on the books you’ve read.
![]()
Title, Author, Series, Pub Date, Pages, Format, and the date started, ended, and days read fields are all pretty self explanatory.
The genre fields, and the fields about diverse characters and marginalized writers require a few notes.
First, be consistent about what terms you use. Currently, the genres listed are as follows:
- DNF
- Thriller
- Contemporary Romance
- Fantasy/Sci-Fi
- Historical Fiction
- Historical Romance
- Paranormal Romance
- Romantic Suspense
- Mystery
- Nonfic
- Erotic Romance
- Regency Romance
- Other/TK
- Teen
You can use different terms but it requires some editing of the tables on the next tab – more on that in a moment. You can also use more than one term to describe a book.
Under Diverse Characters and Marginalized Writers, you also need to be consistent in what you enter in those fields. You can use “Yes” and “No” as the answers, as I have in the sample data, or you can be more specific, as the chart on the next tab will support multiple terms. Just be consistent. You can’t mix up “Yes” and “yes” or your data will be a bit wonky.
New for 2020: Book Source! I am tracking where my books come from, and a few people have asked for a similar option. You don’t have to use it if you don’t want to, of course.
In the sample data, I’ve included four options: NetGalley, Hoopla, Amazon, Library. As with the other columns, you have to be consistent (e.g. NetGalley and Netgalley will produce separate results in the charts on the next tab) but you can enter as many sources as you use to find your books: Scribd, AO3, FanFiction.net, Tumblr, Libby, Little Free Library, etc. The possibilities are endless.
Statistics
Now let’s look at the Statistics page because this is where the magic happens.
Andrea, as the original creator of all this spreadsheet magic, deserves all the praise and wine.

On the second tab, the data you entered from the first tab is turned into graphs, statistics, and charts that allow you to see the results of your reading.
Pivot Tables, Oh Yeah.
The spreadsheet as I’ve shared it has some sample data that you can delete, obviously. That data is only provided to give you a preview of the statistics that are being tracked.
For example:

Books Per Month, Rating Distribution, and Page Count are also displayed in graph form below:

Then we get to Categories and this part allows for customization if you know how to work your spreadsheets (I, for example, do not, and was very nervous about attempting changes).

This is where the tricky editing can occur if you need it.
If you’d like to change the categories or genres, you can, but you need to make that change consistent and make sure to edit the formula in the “Total*” column as well.
The category statistics are compiled from the data entered in column K of the “Books” tab. So if you added “Historical Fiction, DNF” as the genre/category for Pride and Prejudice, your statistics would include 1 Historical Fiction and 1 DNF. As Andrea noted in her original construction, totals may be higher than total number of books because categories may overlap.
You’ll notice that one of the categories is “Other/TK.” That’s the one we’re going to edit so you can add a genre should you need to.
Say you want that category to track a genre you like that isn’t listed here. For example: Westerns!
First, easy part: change the label from “Other/TK” to “Westerns.”
![]()
![]()
Now the tricky part! Click on the next cell in the “Total*” column:
![]()
When that cell is selected, look up – up in the sky! Is it snowing? Kidding. Don’t look at the sky.
Look at the fx area, aka the formula bar. It’s just above the spreadsheet, below the toolbar.

See the part in the formula bar that reads: =COUNTIF(‘Books Read 2019’!K:K,… etc?
Highlight “*Other/TK*” and change that to read “*Westerns*”

Now, when you list a book as a “Western” in the Genres column on the data sheet (aka column K), it will be counted in the Statistics correctly.
Again: the words you use have to be consistent, and that includes capital letters. “Western” and “western” are not interchangeable.
Additional Graphs – Make Your Own, Customize, Have Fun!
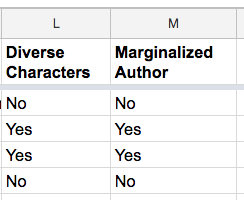
Then there’s the graphs at the bottom: Diverse Characters and Marginalized Writers. You can adjust the titles and the data to fit your own needs or goals, of course.
The data you enter into columns L and M on the “Books” tab create the pie charts on the “Statistics” page:
So:
Becomes:

These charts are based on the sample data I entered, and I kept the fields as “Yes/No” for ease of demonstration.
You can customize these columns and charts to fit your own reading goals, interests, and habits.
For example, if you read mostly queer romance and want to focus on detailed representation of sexuality, instead of Column L reading “Diverse Characters,” you can change it to “LGBTQIA+?” and track more specific options, such as characters who identify as Gay, Lesbian, Transgender, Aro, Ace, etc.
So with this data:

The pie chart would look like this:

As long as you are consistent with the terminology, your chart should accommodate the data.
Make it your own to help you!
Again, the data shown here is all based on the sample books I entered. Once you delete the sample data and begin entering your own, you’ll see your own reading history.
I have found using this spreadsheet to be very inspiring: I want to keep reading and keep adding to my totals, and I already read quite a lot. But I also want to focus on what I read, who I read, and what sub genres I’m reading more of. Seeing my own tastes evolve over a month, a quarter, or an entire year has been very interesting.
Again, you can grab your own copy of the 2020 Reading and Books Data Spreadsheet by clicking this link, and, inside the Google Sheets menu, clicking “File — Make A Copy” to create your own spreadsheet inside your Google Drive.
I hope this spreadsheet is helpful. Again, massive thanks to Andrea for sharing the original version, and to Elyse for customizing the current version.
What do you want to track? Do you think this will be useful for your own reading habits? And did you track last year? What did you think?
Happy New Year of Reading!

I used this all of 2019 based on the one you guys shared then. The TBR tab was a huge help in terms of remembering when all the stuff I wanted was being released (already filled out through August for the one I will be using this year). I added tracking for sources, but only library/buy/gift, and e-book vs. physical book. Since I’m lazy and don’t much care how long it takes to finish something, I only track the finish dates; that still tells me how many books I’ve read in a given month. I was totally unfamiliar with spreadsheets and still managed to do it so it is clearly very user friendly. Thanks so much for this!
I’ve used this since 2018 and it’s soooo amazing! Thanks once again for sharing it!
If anyone’s interested in slight changes I made: I added a column for language. I mostly read in English, but also in German (my mother tongue) and sometimes (rarely) in French. I might give the “source” i.e. where a book came from, a try too!
I also added gender of the author, which can be filled with whatever (m, f, nb…) just too have an overview over how “balanced” I read.
Again, thanks for sharing this back in 2018, it definitely has brought me much joy, especially because I am a statistics nerd 😀
I love learning how you’ve altered the spreadsheet to adapt to your own reading. Thank you so much for sharing – I’m so happy I’m not the only person who loves looking at my own reading history and tracking different elements of it.
I think I’ll be altering the spreadsheet to track what books have triggering content, and if it’s something I can handle or not. Like if I’m reading a dark fantasy or horror book, I’ll be expecting dark content, but urban fantasy not so much (looking at you, Fever series.)
Ahhh-I’ve been excitedly awaiting this since Jan 1st! I loved tracking my reading this way in 2019, and I’m super pumped to be able to track sources now. Last year I just added them to categories (Library, Buy, Own, Scribd, KU…) but now they get their own special section. Thanks!!
This is so exciting! Ok – I glommed onto your (Andreas) spreadsheet since 2018 (thank you). In 2019 I started the new year with a new spreadsheet, but this year I’d like to continue my list and to track over time, in years. I love the monthly bar charts and have an awkward attempt at adjusting the bar chart to continue from December 2019 to January 2020, but I am wondering how others do this. Do you start over every year?
This is wonderful! Thank you!
I’m a relative new romance reader, and I never thought I’d become an addict. But… well.. that happened. And it’s been frustrating me for months now, that I didn’t start following my own reading right away. But this is perfect.
I’m just getting back into tracking my reading after a multi-year hiatus and I’m SO FRUSTRATED with Goodreads. Thank you for offering a good alternative!! I’ve already started some entry and some customizations and I’m so happy 🙂 #nerdalert
@JanetS – I do start over every year – I have a 2018, 2019, and now a 2020 spreadsheet. Are you saying you want to track multiple years on one spreadsheet? Am I reading correctly?
Thank you for this! I am going to try using it. I’ve already customised it – I’ve replaced the sources tracking with a rating of how sexist or feminist a book is. I’ve also replaced the marginalised authors column with the country of origin of the author. This is interesting for me as a European reader who is trying not to read only American books, which is all too easy with today’s book market. (not that I don’t like reading American books, I just want to make sure I read books from elsewhere too).
I have asked a friend who is very good at excel to help me and he’s made the Categories/genre table much easier to customise. No need to tinker with the formulas, I can add, delete and reorder the categories in their column and all the rest adjusts automatically. Sarah I can show you the changes if you’re interested.
Hey Estelle! I’d be delighted to see those changes! Can you email me a copy at sarah@smartbitchestrashybooks.com?
Ah, neato! Count me in among those who were waiting to see if y’all were gonna release a new spreadsheet for 2020.
Changes I made: deleted the Pub Date, Start Reading Date, Pages, and No. of Days Read columns as those aren’t things I track. (I do track when I finish a book but I use a monthly date instead of a mm/dd/yy one).
Also, I changed 8 of the default genres to those that I actually read. And, finally, I added an “author’s gender” column because I am curious as to which gender I read the most.
Other than those things, the spreadsheet is populated and I’m ready to start a-reading. Thanks for posting an updated version and happy 2020!
Hi Sarah – yes, exactly, I am trying for an ongoing list with multiple years, instead of starting over every year.
@JanetS
It should be possible, I think the best option would be just have one spreadsheet with a new tab for each year.I would have to play around, depending on how this year goes, I might see how it would work with 2021.
Overall this spreadsheet is pretty cool. Just a few things. The books per month formulas have not been updated. Also the month of September does not exist.
@Abby, I too am frustrated with Goodreads. Shelfari was so much better (more intuitive & easier to use). I hate that Amazon bought it just to kill it.
Thank you for sharing this! I’ve been tracking my reading with LibraryThing for about 15 years, and am pretty happy with that so far. (Each of your columns becomes a tag within that system, except where they’ve hardwired it in as a feature e.g. stars ratings. I just don’t get the pretty graphs. 🙂
One of the nice things about it is that I’m always updating, even for things I read a while ago e.g. adding AOC or POC tags to existing items in my personal library. And if I reread, I just add the tag for this year. Interesting to compare original ratings/reviews/comments on something I’m rereading.
I have no intention of ever tracking my reading but I’m a database admin by trade so I LOVE your passion for data gathering and analysis and am thrilled that tracking romance reading could be a gateway for some folks into the magic of pivot tables and charts!
I’ve just downloaded the spreadsheet. My 2020 goal (because resolutions=bleh) is to read more, and tracking my books will help me achieve this goal. (I’ve already read 2 this year!)
I’ve still got 2 more vacation days, so I’m going to spend some time customizing the columns – I will track genre differently based on my reading habits, I want to know the author’s country of origin and gender, and I want to know the book format (paper vs. e-book).
This is so cool, thank you for sharing it! I’ve been pondering keeping a list of what I read for a long time but never did. This is gonna be perfect.
This is a great tool, thanks!
I like to add my books when I start reading them, so I don’t yet have a finish date. I modified the calculation for “Days read”, so I don’t get an error:
=IF(ISBLANK(I2),0,DATEDIF(G2,I2, “D”)+1)
And I then copied it down the column.
I work in data analytics, I have never done much on tracking my reading habits except through goodreads, but I am always bummed by the limitations there. If anyone wants to play with some fun charts and visualizations, Microsoft’s Power BI desktop program is available as free download, and you can upload your spreadsheet(s) in as datasets so you can track you reading habits over several years.
I started my own spreadsheet with similar, but less comprehensive data and this is SO MUCH BETTER! It was super easy to transfer stuff, just had to add a little more data.
Right now I’m feeling a little weird about the “Marginalized Author” column bc it is something I think is important to track, but it’s also something that’s weird to define and hard to always know. With some authors, mainly ones I follow on Twitter, I know their race or sexuality or gender identity or about their mental health or socioeconomic status or background because they talk about it online, but it feels weird and kind of gross to actively search for some sort of clue about someone’s sexual preferences because I thought I read that so and so is bi and their characters are so should that count? Or if I know an author is an immigrant and has had issues because of that, but they’re also white, does that count as a marginalized author? And speculating race feels wrong. But I filled in the column to the best of my ability and realized that I’ve read way more books with diverse characters than books by marginalized (as far as I know, I didn’t look into anyone bc of the aforementioned weird feelings) authors and that does seem like something I should be aware of. (data is also skewed right now bc I read several books by the same white author who includes a lot of diverse characters)
Right now I’m feeling like I might change that column, or at least move it so I can still access the data but use the graph to track something else. Maybe switch the graph to genres and use the section that’s formatted to track character rep? IDK, if anyone has suggestions or something I’d love to hear them!
Also, I added a column to track where I hear about books (here, specific twitter users, generic “I saw it on twitter from someone (or many someones) but I don’t remember who”, and trusted authors) so I can get a general sense of how many new-to-me authors I’m reading. Thinking about adding a column to track price, but I have a feeling that will make me very very sad.
I’ve changed something else in mine, I changed the book format to whether the book is self published or from traditional publishing. I almost always read ebooks and am not really interested in knowing that I’ve read only a handful of paperbacks in a year. I am interested though in knowing what proportion of self published books I read though so that was an easy change to make.
Sarah I did send you the spreadsheet a week or so ago. I don’t know whether you’ve received it. You don’t have to answer the email, I was just not sure if it had been received or if I made a mistake with the address or something.
OH! Yikes – I just fished it out of my spam filter. Thanks, Estelle! Sorry about that!
Haha no problem, I don’t want to sound like I’m harassing you! I understand you must be very busy 🙂
I just updated the Statistics tab on my copy — the “Books Per Month” section is hard-coded to 2019. I updated the 12 calculations to 2020. That automatically updated the bar graph.
YES – I’m so sorry about that. The current linked version is updated to 2020 but I missed that when I did the post originally. I’m sorry – and thank you!
I used this last year and have added more tabs and more charts. I added tabs for what I own. I’m failing at keeping up with that. I’ve added tabs for upcoming conferences and authors I want to read prior. I’ve kept the TBR list, though I track that in many places. The TBR is handy for when I pre-order or buy on sale, I can note where the book is. On the stats tab, I added a chart for publication date, because I was curious how much I was reading from older pub dates. I’ve also added a graph for what format I’m reading. I have an idea which format I read the most, but I wanted hard numbers.
In the spreadsheet, in the “Statistics” tab, the field for “Days Left” B9 has the value of zero.
Is is meant to calculate something?
Oh, darn – thank you for catching that! I think it’s meant to calculate the days left in the year. Let me see if I can track down the formula for that. Apologies!
Thank you so much for this! I have been looking for a book tracking spreadsheet for a while now and although I have found numerous ones available online from other people, they have never suited my purposes and have been too difficult for me to be able to modify myself.
This one is perfect – it tracks the basic necessary information and is so easy to customise too! Thank you so much for sharing it.
I have made a few changes though – firstly the colour scheme; mine is now in pretty pastel colours. I also changed the Diverse Characters collumn to Audience (Adult, YA, etc) and the Marginalised Author collumn is now Author Gender. I also now have pie charts for Author Gender, Audience, Source and Format.
I can’t, however, figure out the formula for the Day’s Left section so if anyone has been able to figure it out could you let me know, many thanks!
Apologies, Karen! The formula should read:
=DATEDIF(TODAY(), DATE(2020,12,31), “D”)
Not sure what I’m doing wrong but when I copy and paste that formula in, it comes up with an error message. I think I’m just going to have to leave it blank for the time. Thanks anyway, Sarah!