
 Last year, Elyse and I tracked our reading using a very handy spreadsheet that was created and shared by Andrea in the comments of a recent podcast, Episode 275, about Reading Habits. We shared a copy of it using Google Sheets with everyone.
Elyse has updated it for 2019 – so get ready for reading spreadsheet wonderment!
As always, our most effusive thanks to Andrea, who created the original version and shared it with us. Thank you, Andrea! You are entirely marvelous and have changed our lives, no lie, no exaggeration.
Elyse has made some updates, so if you’re ready for 2019, we have our new edition ready to go.
Want to download and get started now?
JUMP DIRECTLY TO THE SPREADSHEET
If you’d like to learn more about why we are tracking our reading, well, read on!
Tracking your reading? Doesn’t that mean you’re entering a lot of books?
Oh, yes. Yes, it does. And that means more delicious data!!
Some background: a few years back, I created a Google spreadsheet to track what I wanted to read and when, what genre it was, when the book was coming out, and where the book or ebook file was so I could find it. Present and Future Sarah do not ever remember what Past Sarah did, so Past Sarah needs to leave us notes. (We get along pretty well, the three of us, thanks for asking!) And since I receive a lot of books well in advance of publication date, or after a long library hold, leaving myself a record helps me manage my reading.
After Andrea commented on Podcast 275 and shared a link to her spreadsheet, I began keeping both spreadsheets: one to track what I’m going to read in the future (mine), and one to track what I have read so far (Andrea’s).
Seriously, why track your reading? Why not just…read?
Well, first, as I said last year, it makes my nerdy heart so happy to see how much I’ve read. I know how many books I’ve read each month, how many pages, how long it takes me to read or listen to a book, and what sub-genres I’m reading the most of this year.
Looking at my 2018 data allows me to spot trends or changes in my tastes. I can see that I read a lot more in some genres, like mystery and historical fiction, than in others. I also noticed that when I expected to be reading more books, I read less than other months. My reading for July and August dipped considerably, partly because I was listening to a series of audiobooks (which takes me longer than reading a book) and because I wasn’t in a place where I could feasibly read as much. But winter? Boy howdy do I read a lot.
My 2018 spreadsheet also gives me ideas for reading goals and updates for 2019. I know the 2018 data isn’t complete, for example. I know I forgot to include some books. I’d get busy, or read a slew of samples in a row (which I did not count on the spreadsheet, though thinking about it I could do so) and I’d forget to update. If I want a more complete picture, I need to step up my record keeping, so I set up regular reminders to log my reading.
I have also started keeping very brief notes alongside each book entry or sample entry explaining why I stopped reading, or what I liked about a particular book. And I’ve updated my list of sub-genres to better reflect what I’m most interested in reading.
But the most important reason for me to track my reading is, as Peter Drucker said:
What gets measured gets managed.
In other words, if I want to manage, change, or pay closer attention something, I have to track it and measure it.
If I want to know how many contemporary romances I read compared to historicals, I need to track it. If I want to know how long it takes me on average to finish a book, I need to track that, too. If I want to know that my reading has been more inclusive and featured more characters and authors from marginalized communities, I need to track that. Having tables of data that update as the year progresses means I’m more aware month-to-month what I’ve been reading. I try to read more widely, more inclusively, and more consciously than I did the prior month. Having data and a place to put my reading tally means I’m more aware as each month goes by.
With some of the modifications Elyse and I made to Andrea’s excellent spreadsheet, I’m doing all of the above.
So now that you’ve got all these new books to read (woo hoo!) let’s talk tracking! For the shared version, I’ve combined my Planning sheet and Andrea’s original Reading sheet into one spreadsheet with three tabs. You don’t have to use the To Be Read tab if you don’t want to, but in case it would be useful, it’s available.
Here’s a link to a copy of the 2019 Reading Tracking Spreadsheet:
https://docs.google.com/spreadsheets/d/1hYiG_pEPEp2JL3tmQCfJ7O7U0QynMDMTX9kSLc-FHLs/edit?usp=sharing
This link is view-only.
All you need to do is click File, then Make a Copy to save your own version to your Google Drive.
Books
![]()
Let’s take a tour, shall we? Starting with the BOOKS tab. This is where you enter the data on the books you’ve read.
![]()
Title, Author, Series, Pub Date, Pages, Format, and the date started, ended, and days read fields are all pretty self explanatory.
The genre fields, and the fields about diverse characters and marginalized writers require a few notes.
First, be consistent about what terms you use. Currently, the genres listed are as follows:
- DNF
- Thriller
- Contemporary Romance
- Fantasy/Sci-Fi
- Historical Fiction
- Historical Romance
- Paranormal Romance
- Romantic Suspense
- Mystery
- Nonfic
- Erotic Romance
- Regency Romance
- Other/TK
- Teen
You can use different terms but it requires some editing of the tables on the next tab – more on that in a moment. You can also use more than one term to describe a book.
Under Diverse Characters and Marginalized Writers, you also need to be consistent in what you enter in those fields. You can use “Yes” and “No” as the answers, as I have in the sample data, or you can be more specific, as the chart on the next tab will support multiple terms. Just be consistent. You can’t mix up “Yes” and “yes” or your data will be a bit wonky.
Statistics
Now let’s look at the Statistics page because this is where the magic happens.
Andrea, as the original creator of all this spreadsheet magic, deserves all the praise and wine.

On the second tab, the data you entered from the first tab is turned into graphs, statistics, and charts that allow you to see the results of your reading. Pivot Tables, Oh Yeah.
The spreadsheet as I’ve shared it has some sample data that you can delete, obviously. That data is only provided to give you a preview of the statistics that are being tracked.
For example:

Books Per Month, Rating Distribution, and Page Count are also displayed in graph form below:

Then we get to Categories and this part allows for customization if you know how to work your spreadsheets (I, for example, do not, and was very nervous about attempting changes).

This is where the tricky editing can occur if you need it.
If you’d like to change the categories or genres, you can, but you need to make that change consistent and make sure to edit the formula in the “Total*” column as well.
The category statistics are compiled from the data entered in column K of the “Books” tab. So if you added “Historical Fiction,” and “DNF” as the genre/category for Pride and Prejudice, your statistics would include 1 Historical Fiction and 1 DNF. As Andrea noted in her original construction, totals may be higher than total number of books because categories may overlap.
You’ll notice that one of the categories is “Other/TK.” That’s the one we’re going to edit so you can add a genre should you need to.
Say you want that category to track a genre you like that isn’t listed here. For example: Westerns!
First, easy part: change the label from “Other/TK” to “Westerns.”
![]()
![]()
Now the trick part! Click on the next cell in the “Total*” column:
![]()
When that cell is selected, look up – up in the sky! Is it snowing? Kidding. Don’t look at the sky.
Look at the fx area, aka the formula bar. It’s just above the spreadsheet, below the toolbar.

See the part in the formula bar that reads: =COUNTIF(‘Books Read 2019’!K:K,… etc?
Highlight “*Other/TK*” and change that to read “*Westerns*”

Now, when you list a book as a “Western” in the Genres column on the data sheet (aka column K), it will be counted in the Statistics correctly.
Again: the words you use have to be consistent, and that includes capital letters. “Western” and “western” are not interchangeable.
Additional Graphs – Make Your Own, Customize, Have Fun!
Then there’s the graphs at the bottom: Diverse Characters and Marginalized Writers. You can adjust the titles and the data to fit your own needs or goals, of course.
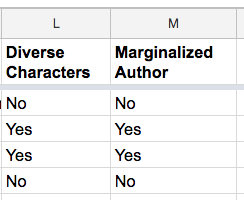
The data you enter into columns L and M on the “Books” tab create the pie charts on the “Statistics” page:
So:
Becomes:

These charts are based on the sample data I entered, and I kept the fields as “Yes/No” for ease of demonstration.
You can customize these columns and charts to fit your own reading goals, interests, and habits.
For example, if you read mostly queer romance and want to focus on detailed sexuality representation, instead of Column L reading “Diverse Characters,” you can change it to “LGBTQIA+?” and track more specific options, such as characters who identify as Gay, Lesbian, Transgender, Aro, Ace, etc.
So with this data:

The pie chart would look like this:

As long as you are consistent with the terminology, your chart should accommodate the data.
Make it your own to help you!
Again, the data shown here is all based on the sample books I entered. Once you delete the sample data and begin entering your own, you’ll see your own reading history.
I have found using this spreadsheet to be very inspiring: I want to keep reading and keep adding to my totals, and I already read quite a lot. But I also want to focus on what I read, who I read, and what sub genres I’m reading more of. Seeing my own tastes evolve over a month, a quarter, or an entire year has been very interesting.
Again, you can grab your own copy of the 2019 Reading and Books Data Spreadsheet by clicking this link, and, inside the Google Sheets menu, clicking “File — Make A Copy” to create your own spreadsheet inside your Google Drive.
I hope this spreadsheet is helpful. Again, massive thanks to Andrea for sharing the original version, and to Elyse for customizing the current version.
What do you want to track? Do you think this will be useful for your own reading habits? And did you track last year? What did you think?
Happy New Year of Reading!

Thanks Andrea, Elyse, and SB Sarah for the spreadsheet! I am going to try this. I haven’t made more than a simple list before, but I wasn’t consistent and now have lost track of what I’ve read (and what I’ve thought of what I’ve read).
Question: I know I can change the labels, but what does the TK stand for in “Other/TK”?
I think I’d like to track format (paper, electronic) and also source (library, purchased, borrowed, gift, etc.). And maybe cost in some way (purchase price, library fine), how acquired, and if it’s a keeper. I guess I’m interested in the physicality of my reading and how much I’m spending on it.
“TK” is abbreviation in publishing for “to come.” It’s a placeholder that signifies, “more words to appear here.” Sorry for the confusion! I’m so used to seeing it I didn’t explain! My bad.
@Violet: I added those columns to mine – one for what format it’s in and another for how I acquired it (owned, library, etc). To do this, I just added those columns to the end and mimicked the info used for the graphs. It was rather easy to do, as someone who knows zilch about that stuff.
I have a goal during 2019 to only read books that I have in my Kindle, instead of impulse buying cheap ebooks all the time (that never get read.) I’m letting myself get books from the library, and letting myself buy the next book in a series, but restraining myself on deals. I think this chart will help me stick with that goal.
I added a ‘library/own/ARC’ field to mine as well, I like to know where I source my reading materials.
Thanks for the inspiration. I started to track last year, but only did the first 2 months. Here’s to sticking with it this year!
I am going to make a chart for format – ‘hardcover/paperback/ebook/audio book’
but I do not keep track of how long it takes me to read a book – I often have 5-8 going at a time, and that information for me personally is not so essential, because it is not an accurate indicator of how much I loved/enjoyed the book or the speed with which I read the book.
I love how the chart is customizable, thanks for this!!
someone gave me a little notebook designed for tracking reading…I don’t think I’ll use it. I don’t really pay attention to my goodreads total once I achieve my goal. I even underestimate so I know I will make the goal.
I can understand bloggers keeping track or super readers, but I have too much going on. I do like your spread sheet. But when I see a spread sheet, my eyes glaze over. lol
I keep my own very basic spreadsheet on my iPad with the list of books/authors I’ve either already got in the reading queue or have preordered (with the expected publication date), a spot for a “grade”, & a note whether or not I’ve reviewed it. I write my reviews In Word, post them to Amazon & can keep track of them that way.
As a note, when I first learned to read (first library card at age 4!), Mom & Dad insisted that I check out one non-fiction or “serious” book for every three novels – no, I don’t know why three was the magic number – & that I couldn’t get everything in the same genre. I still follow that, so a look at my TBR list is a wide cross-section of stuff.
I’ve also noticed that the older I get (in my 50s now), the less patience I have with books that don’t grab my attention. There was a time I’d always finish a book I started, but now I’m becoming ruthless in abandoning one that doesn’t work for me. Less remaining time on earth for unexciting pastimes, I guess!
I was going to just keep doing the Goodreads challenge to keep track of everything, but this is way more useful! I especially like the DNF option; that’s my number one issue with Goodreads. Thank you so much for all your hard work!
This is amazing. . . but I’m realistic about my ability to commit to something like this. I’m pretty lazy and think I’m doing great just by remembering to update GR as soon as I finish a book. Kudos to you super-organized folks.
I think how much data you collect depends on individual preference but keeping a simple list has definitely helped me finish books that are worth finishing rather than flitting on to something else and leaving decent books forever abandoned. I just record (with pen and paper!) the title, author, source (amazon, library, audible, etc.), date finished, genre and format (ebook, paper, audio). Also whether it was a kindle unlimited book, which helps me see if the service is still value for money.
I am always reading at least 3 books at once in different genres and formats but I get them finished now. And I reached last year’s reading goal with an hour to go on New Year’s Eve! Nobody cared but me but it felt satisfying.
@oceanjasper: You said, “Also whether it was a kindle unlimited book, which helps me see if the service is still value for money.”
Oh, that’s a smart idea if you’re a KU subscriber. Knowing the source if it’s a subscription service would be very handy! That is very good thinking – thank you!
I have a spreadsheet that lists all the e-books and short stories I have. Before I buy anything new I search it for the title so I don’t pay for a duplicate of something I already have.
I have a column for the name of a collection or box set, another column for author, and one for title of the book/short story. For each collection I list all of the books/stories separately. That way I don’t accidentally buy an individual title that I already have in a collection.
I have a bunch of other columns but have been too lazy to fill them in consistently. I’m not as motivated to use them because they don’t save me money.
Because I don’t want to count the number of days between the dates (when the month changes having to recite “Thirty days hath September…” makes me lose count), I have just changed that cell to have the formula
=DATEDIF(G3,I3, “D”)+1
The “D” is for days, and +1 is because the formula makes it so that one of the days isn’t included, so I correct for that.
Also, the Days Left cell in the Statistics tab I think is supposed to be a countdown to the end of the year? It’s currently set to 0, so if you want to fix that use this:
=DATEDIF(TODAY(), DATE(2019,12,31), “D”)
I think I’ll probably make something that’ll keep track of all the different authors I’ve read and how many books of theirs I’ve read. The keeping track of costs thing people already mentioned seems like fun to do, too…
Um, maybe I’m a little too into data.
@Emily: These are brilliant additions. Thank you!
FYI, for people like me who prefer Excel over Google docs, instead of “Make a copy” you can choose “Download” and save to your computer as an .xls file.
Thanks to all for sharing ideas!
Thank you for the tip about excel! Google docs did not tempt me. Excel however makes it seem possible…
I love this, it’s so fun to play with! I’m finding it pretty easy to copy and paste to make new pie charts, but I’m not sure where the book format data ends up?
I try to track stuff on Goodreads in the “shelves”, but I’m loving being able to see stats. I really like to track primary and secondary characters of color separately. I appreciate secondary characters, but I’m trying to prioritize protagonists of color. I’m really excited to start track working class and cross-class romance because I’m guessing I read those a lot, or at least give them higher ratings. I’ve done an interracial romance reading challenge the past couple of years and it’s going to be an upgrade from the long note on my phone.